Automotive & mobility
B2B
Modernising a 40-year-old automotive intelligence platform to compete in a fast-moving data economy
Client
Model

Services
Info
JATO Dynamics needed to evolve from a legacy data provider into a modern intelligence platform to respond to changing client demands and capture new market categories.
JATO had to fundamentally rethink how it understood and served customers across 50+ countries.


Challenge
JATO faced three challenges: product teams were disconnected from customers, legacy assumptions were misaligned with market realities and siloed verticals that operated independently without shared insights.
This fragmentation limited competitive product development, whilst rivals increasingly offered integrated platforms with modern UX and reporting capability.
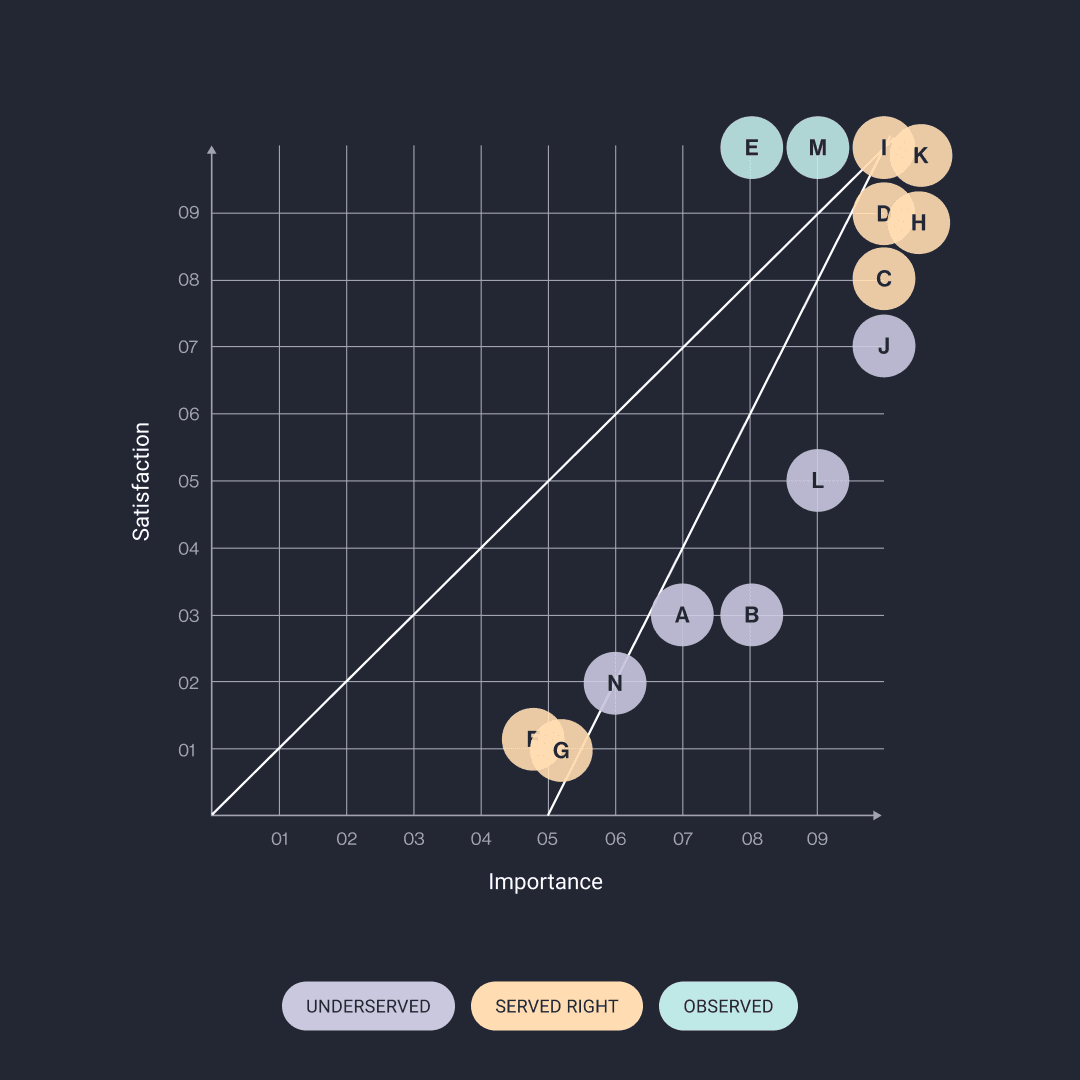
Our analysis
The JATO product team knew they had a problem but needed to cut through internal politics, process blockers and paralysed decision making to secure precious technical resources. A fundamental rethink of how JATO understood customer value and made product decisions was needed.
Application of evidence-based design thinking would unite teams and end decision paralysis.

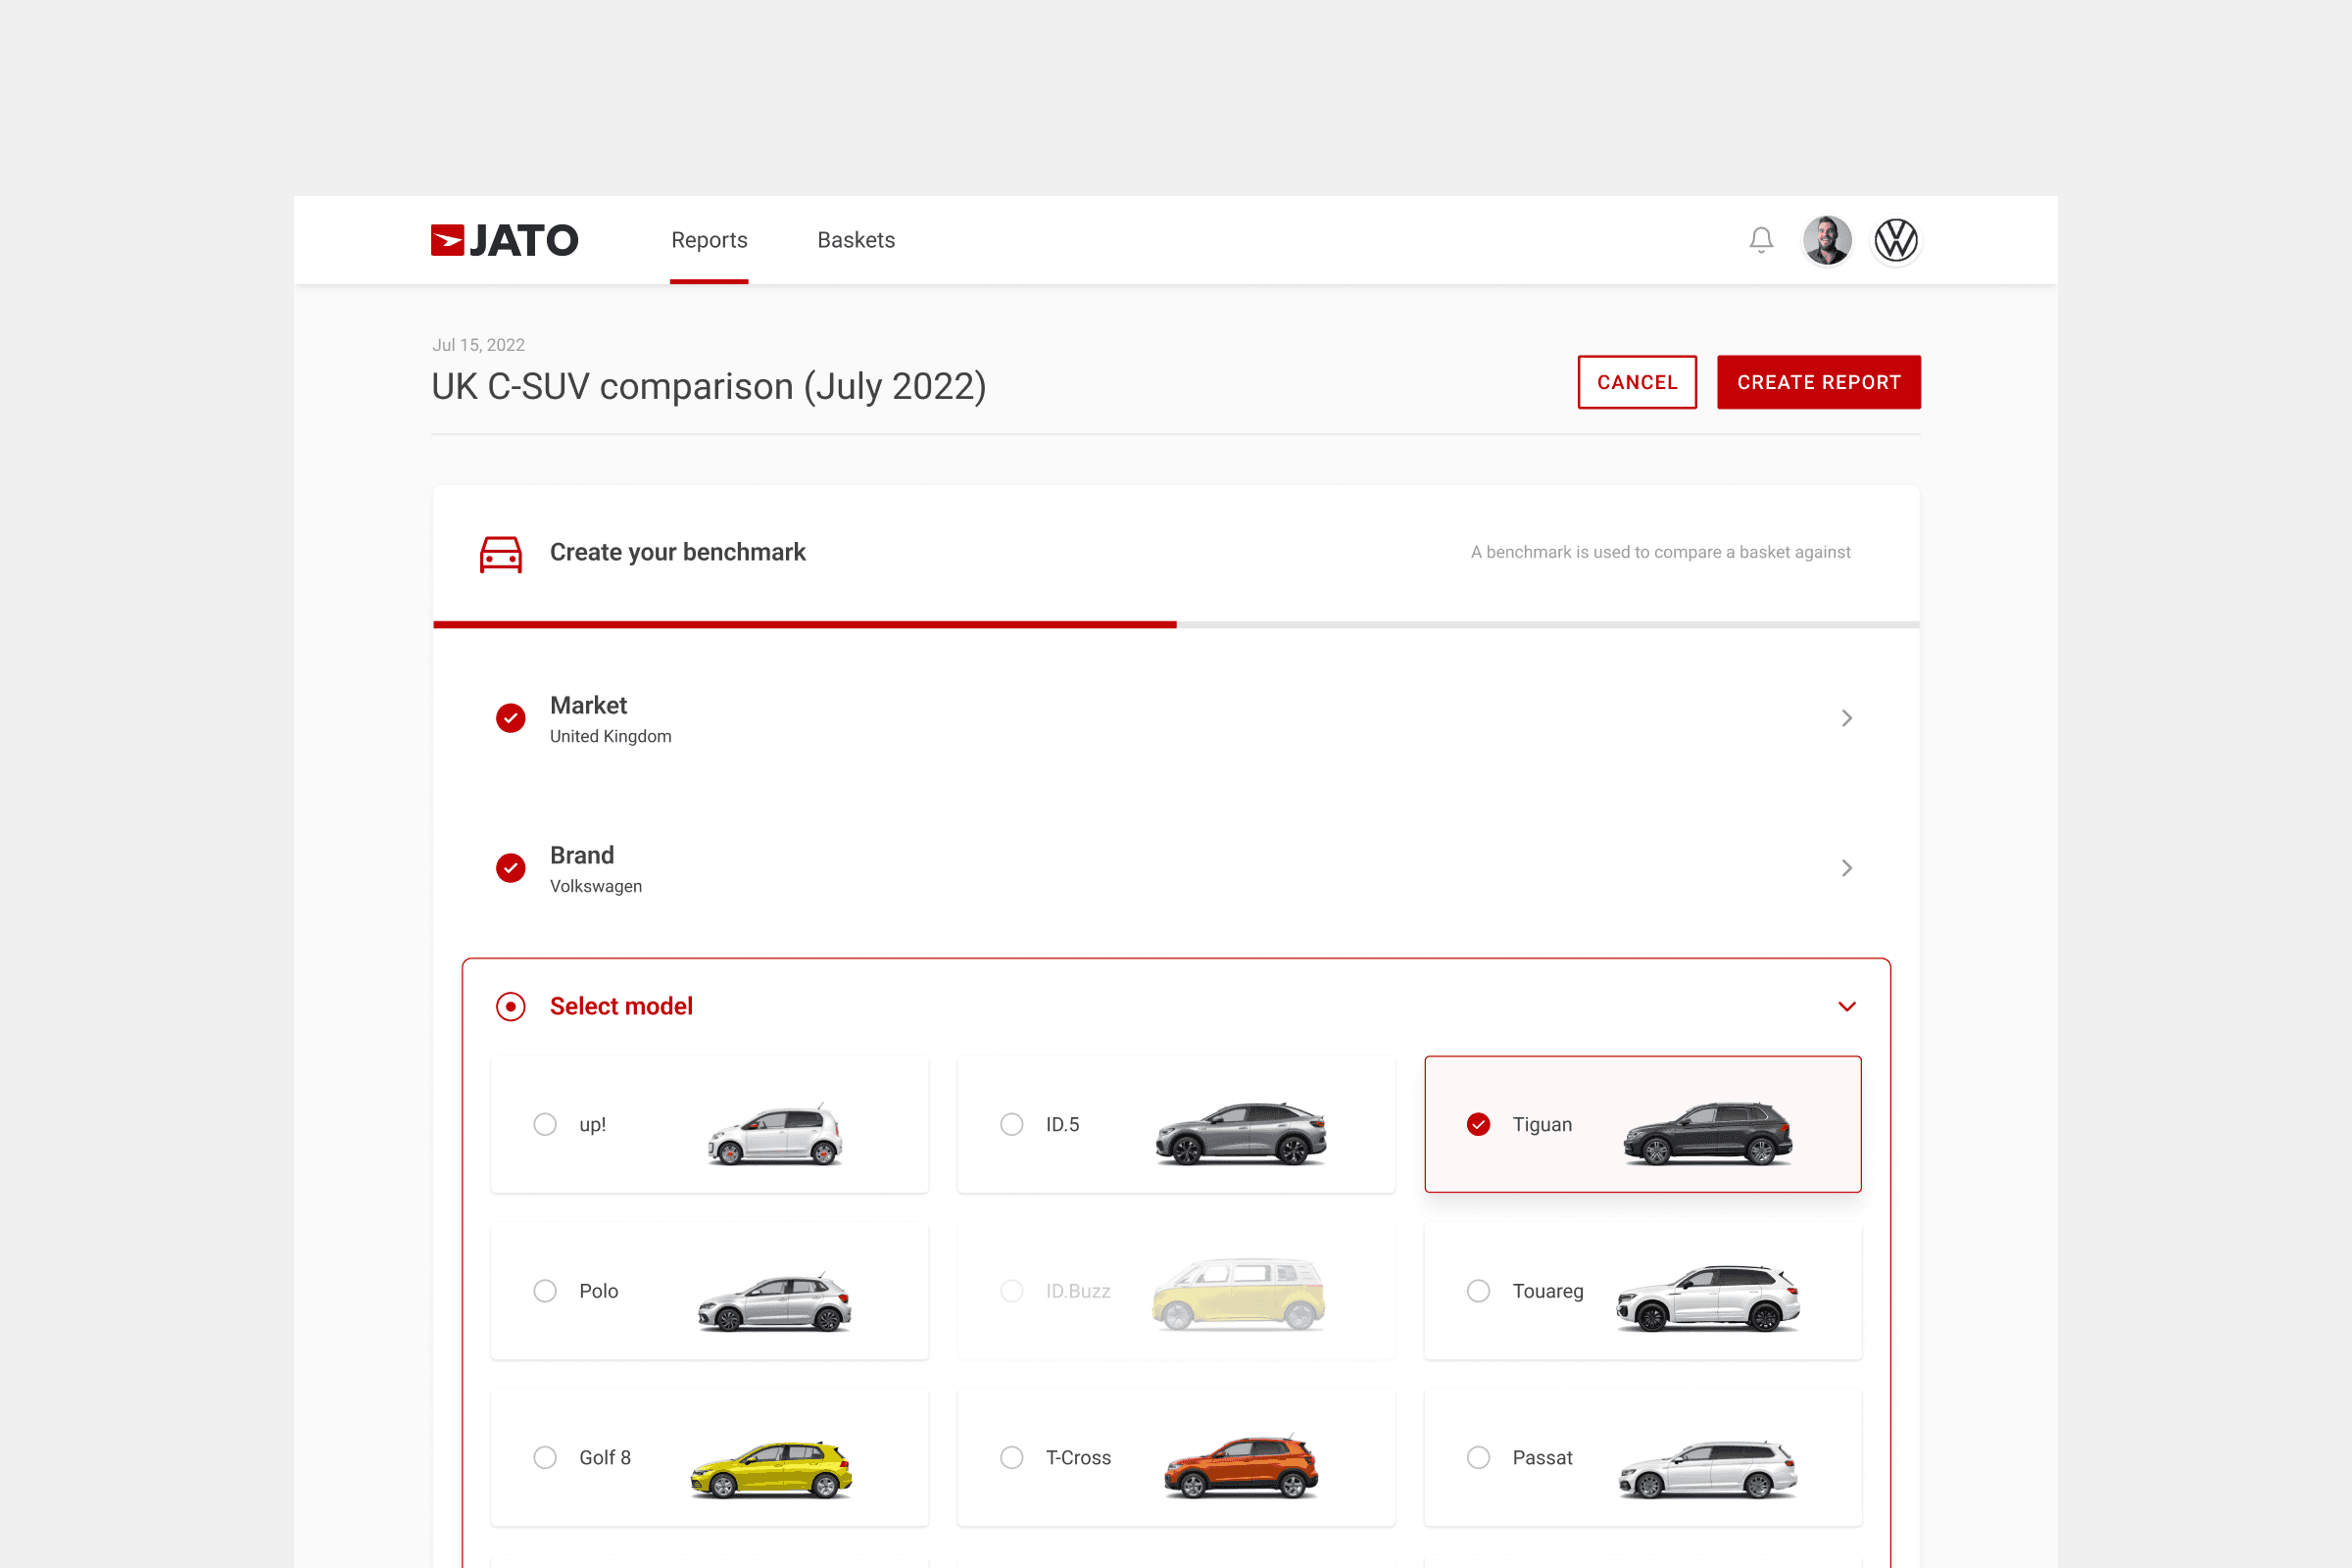

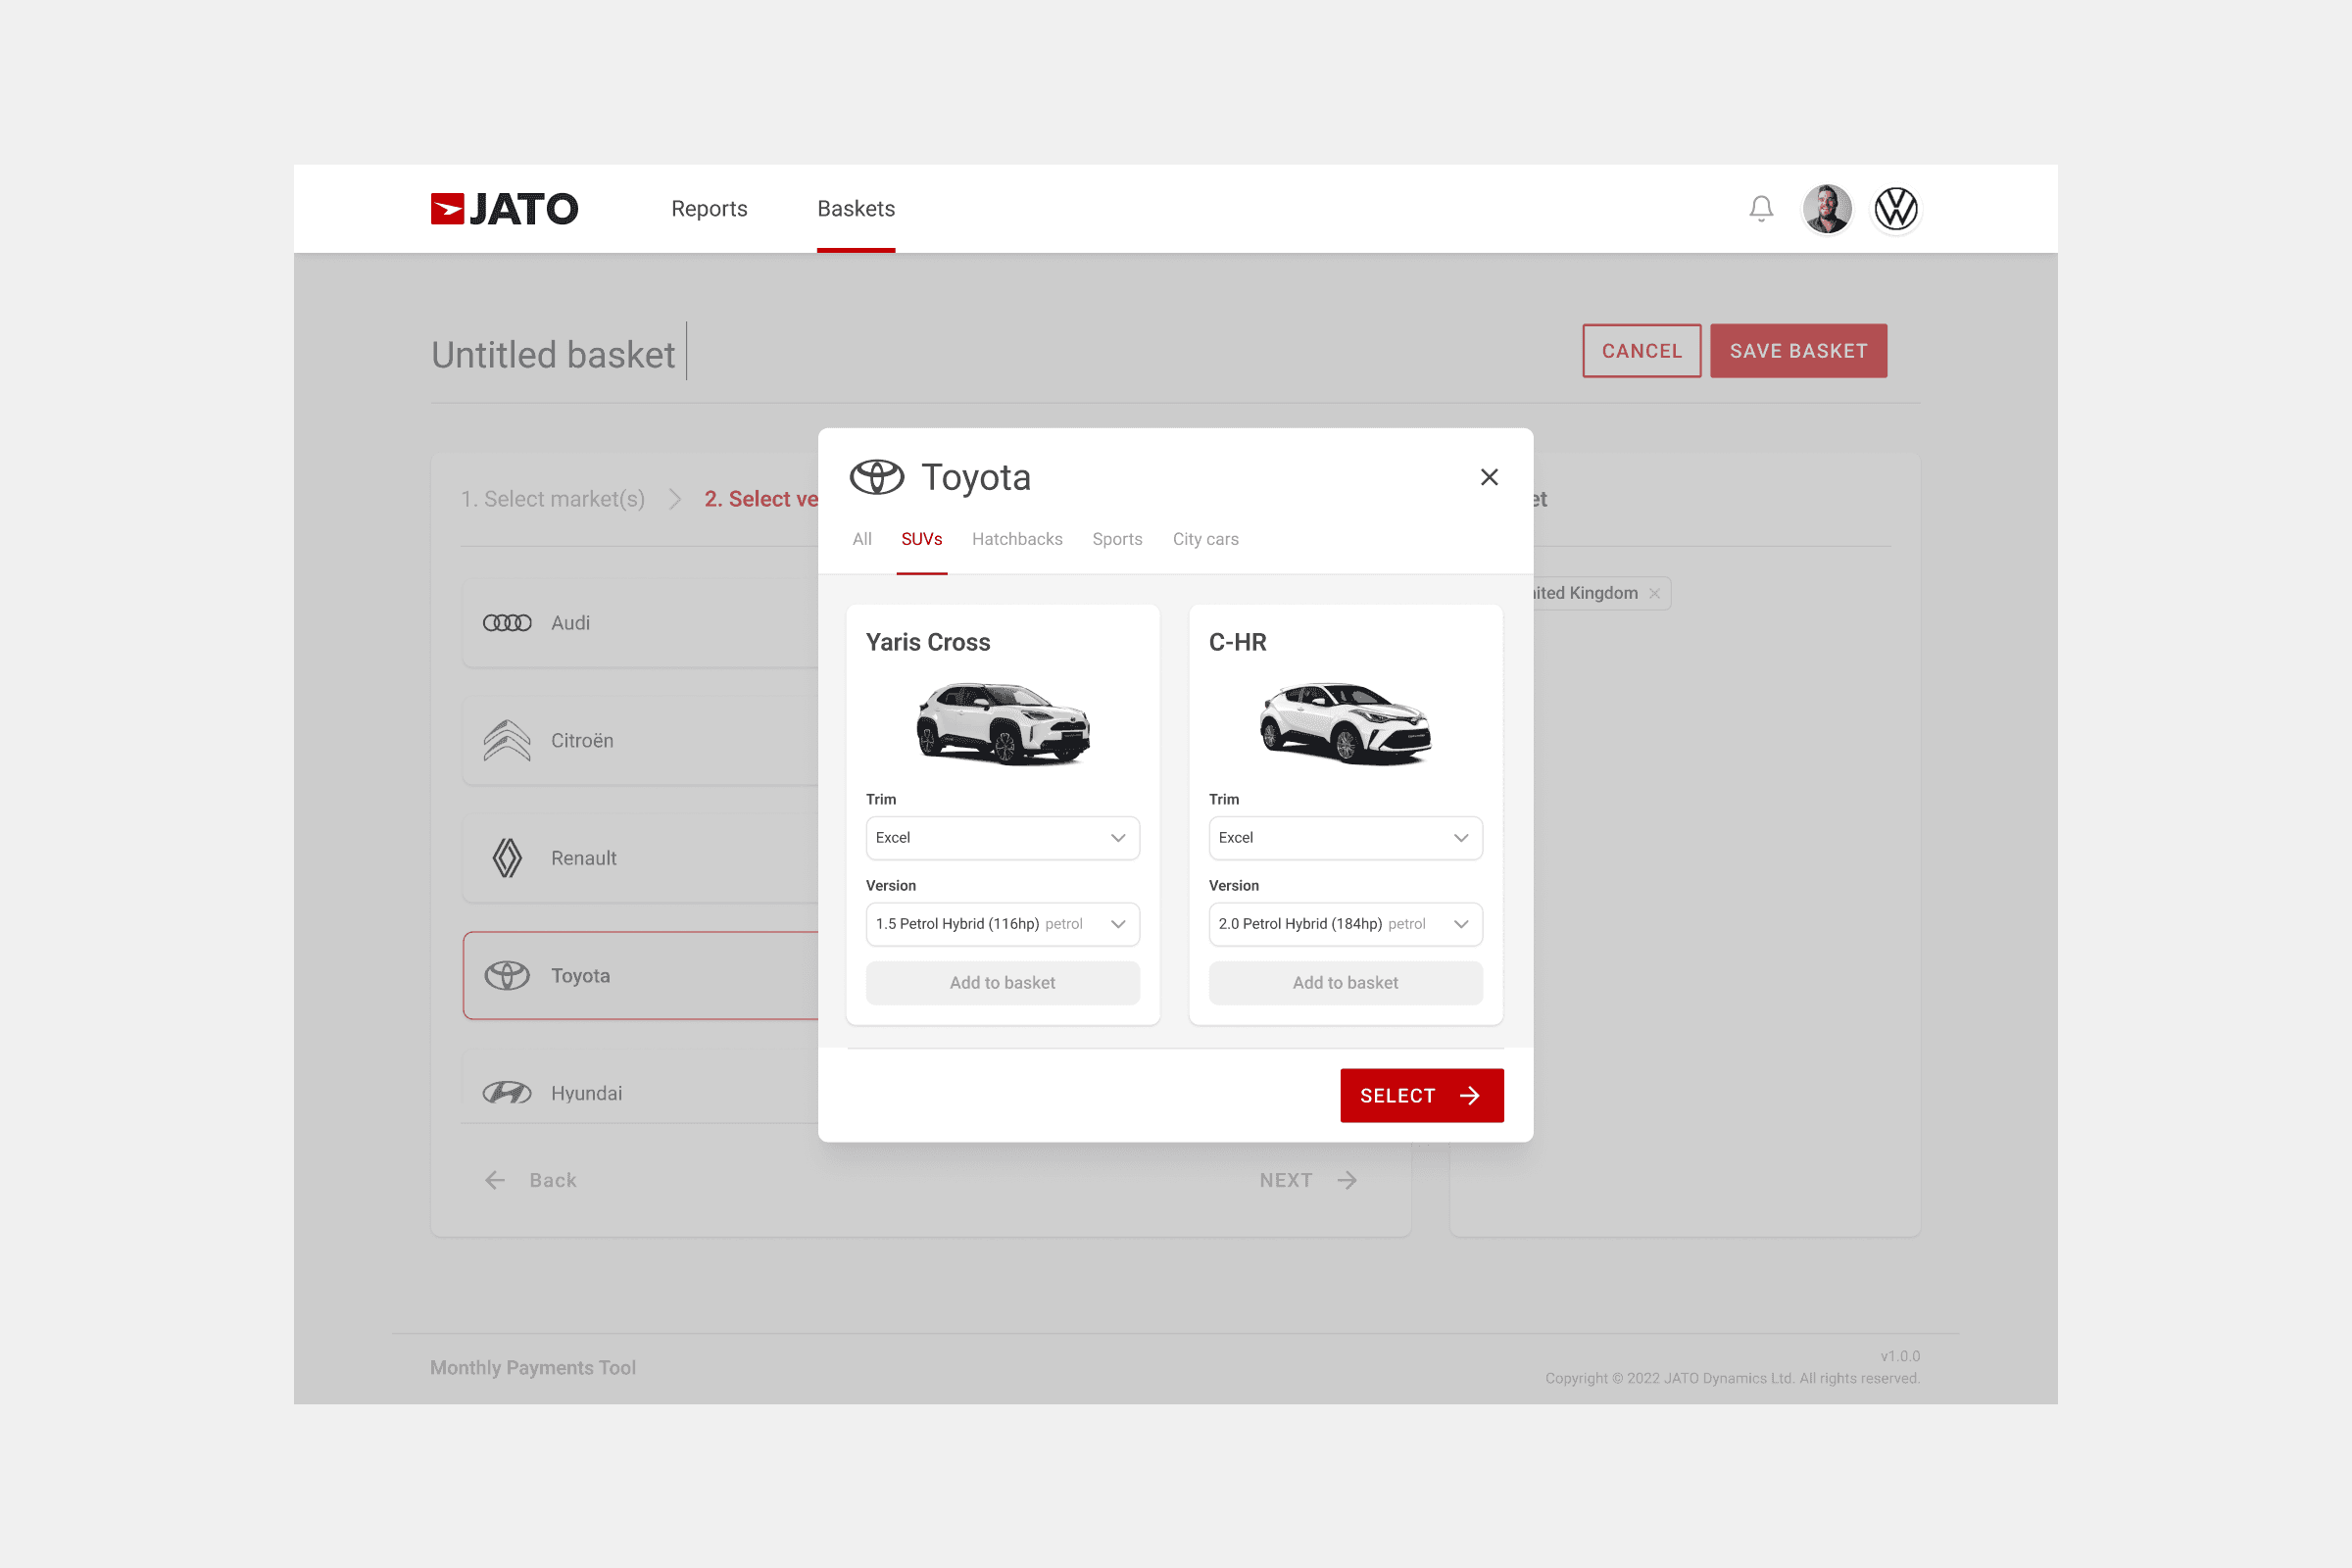
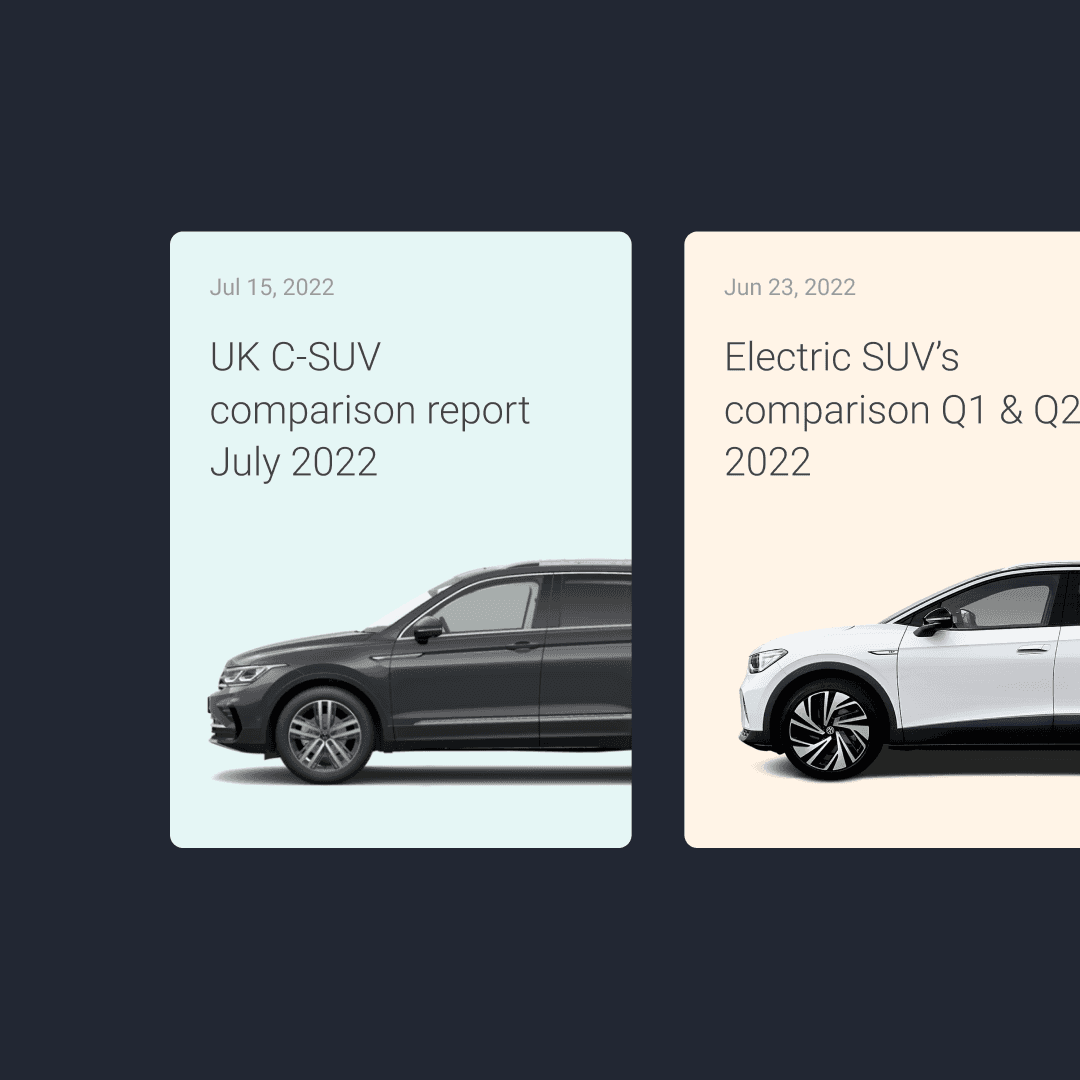
What we did


Project impact
Turn customers into co-creators, and end the internal debates
Established companies have to modernise legacy platforms for fast-changing markets, but often lack real customer input into the decisions.
Co-creation turns customer insight into clear direction.
Our jobs-to-be-done approach makes customers active partners, so the direction is grounded in evidence rather than guesswork.